
/reports
Reports is the fleet dashboard: what your agents produced, where pools are depleting, and what’s waiting on you. It opens with a written headline — a one-line thesis about the window — then a KPI strip and findings, each finding deep-linking into the agent evidence it came from.
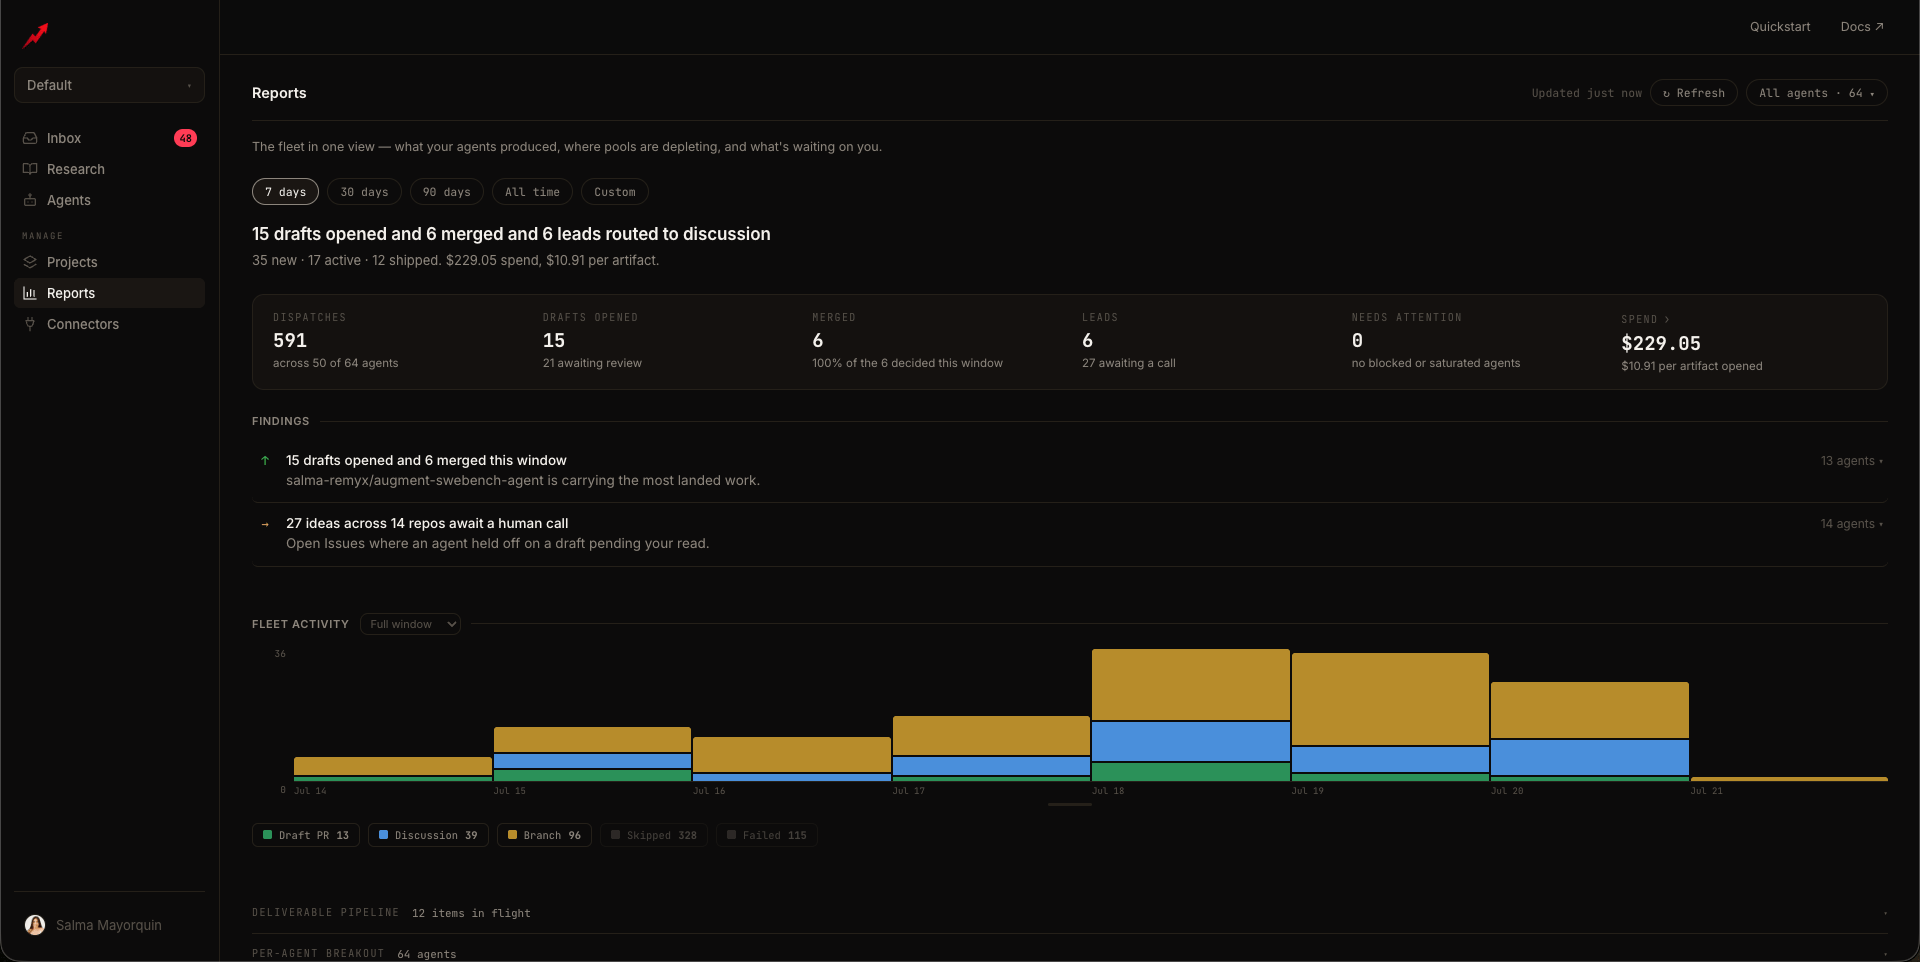
- Agent picker — all agents or a subset; the scope carries into every chart and drill-down.
- Date window — the same window control as agent views, from 7 days to All time.
Fleet activity
A daily stacked-bar chart of run volume by outcome kind — Draft PR / Discussion / Branch / Skipped / Failed — with spend overlaid. Legend chips toggle outcome kinds; zoom presets narrow to the last 90/30/14/7 days.Deliverable pipeline
Everything currently in flight, as cards: drafts and discussions with title, repo, age, and a direct Open ↗ link. This is the maintainer-facing work the fleet has put in front of you, in one place.Per-agent breakout
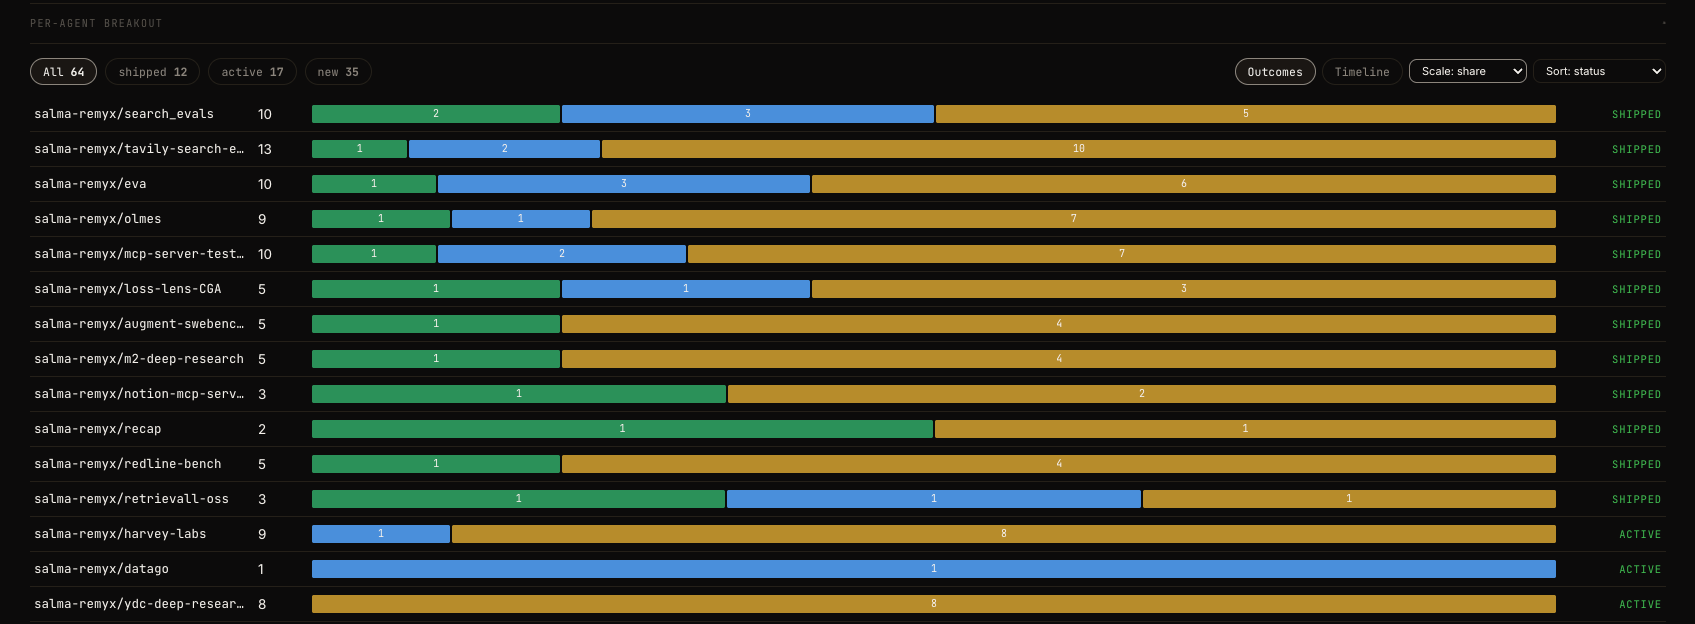
Each agent classified into one of six states, filterable by chips (the summary counts how many need attention — blocked plus saturated):
Two views of the same data:
- Outcomes — proportional stacked bars per agent, scaled either absolute (bar length by busiest agent) or as share (100% rows).
- Timeline — a contribution grid: one cell per day (per week on long windows), colored by the highest-signal outcome that day and shaded by run count. A season of agent work reads at a glance, like a GitHub contribution graph for your fleet.
Costs
The Spend KPI drills into/reports/costs (carrying your window and agent scope): unit economics for the fleet. Runs per day stacked by model backend — toggle between one series per provider or per model — against a ** / artifact” KPIs. Runs carry their coding agent, backend, model, and tier (main / drafter / refiner), so a two-tier setup shows exactly what exploration costs versus promotion. A run whose agent reports no dollar figure is left out of spend rather than counted as $0, and the number of those runs rides along — so a partial total says so instead of quietly understating.
Programmatic access
The same report is available from the MCP server (get_fleet_report) and the REST API (GET /outrider/agents/report), scoped to your own agents.
Related
Inbox
The action items behind “needs attention”
Agents
Drill into one agent’s runs, direction, and trace
Model backends
What drives the cost-per-artifact differences
Projects
Scope the fleet to an initiative